Service Dashboard Page Overview
Service Dashboard Page Overview
Purpose
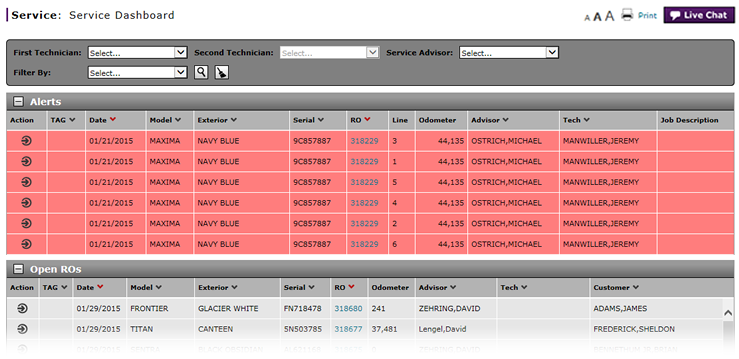
The Service Dashboard allows you to view service alerts and open repair orders (ROs) in one, user-friendly interface. DBS automatically updates the Service Dashboard page each time a vehicle alert or RO is created or modified. All entries in the Alerts section match keywords from an EDS study.
Note: An EDS study is created by DBS Internal users to track information related to vehicle performance or construction. The main study categories are General, Hold, and Informational. Technical Service Bulletins (TSBs) are part of informational studies.
It is very important to look at the Alerts section regularly so you can respond appropriately to service alerts, especially to vehicle holds. Each dealership may have different procedures for responding to vehicle holds. For example, a dealership might respond by telling customers about the issue and then communicating with the Engineering department for items to be addressed. At times, vehicles may also need to be recalled.
Tip: In addition to checking the Service Dashboard page regularly, you may also receive notifications when EDS studies are created. Typically, Service Managers are part of the DBS notification process in which they receive an email when one or more study types are created.
Description
The content area of the Service Dashboard page displays the following sections:
- Filter - Allows you to filter the information to display only the records that match your criteria
- Alerts - Displays job lines from ROs that have alerts associated with them. DBS places a repair order job line in the Alerts section when the job line matches any of the following criteria:
- Active Hold Study
- Active Informational Study
- Technical Service Bulletin (TSB) keywords defined in one or more EDS studies
- Open ROs - Displays all open repair orders without alerts
Color-Coding in Alerts Section
Color-coding in the Alerts section is designed to help you quickly identify the type of alert being issued by NNA/NCI, as described in the following table.
Matched Study Type |
Color Highlight |
|---|---|
|
Vehicle Hold Only |
Red |
|
Vehicle Hold and Informational |
Red |
|
Informational Only |
Yellow |
|
Linked TSB with matching keywords |
Yellow |
Tasks
You can perform the following tasks from or on the Service Dashboard page. Depending on your user role, you may not be able to perform all tasks.
Workflows
One or more tasks in the following workflows are performed on the Service Dashboard page.
Page Preview
